Bring All Confidential Reports Into One Secure Place
We’ll assess your needs and recommend the right setup for anonymous reporting or surveys - aligned with your compliance or HR goals.
Legal & Compliance

Alaa El-Shaarawi
Copywriter and Content Manager
Published
2026-04-10
Reading time
6 min

Table of contents
Subscribe to our newsletter

A compliance officer preparing for a quarterly risk review notices something unusual. Several low-severity procurement concerns have popped up across different departments. Individually, each case seems minor. Together, they make her pause. Is this just coincidence, or an early signal of a broader control gap?
She feels that familiar tension, the one every compliance professional knows. Reports are piling up, deadlines loom, and leadership expects answers. Her reporting system shows individual cases, but it doesn’t show how those cases relate to vendor spend, training completion rates, or team turnover.
Without connecting report data to these operational metrics, risks could slip through the cracks. A cluster of minor procurement disclosures might look harmless on their own, but paired with concentrated vendor spend or inconsistent onboarding, they could signal a deeper control issue. And later, she knows, regulators will ask hard questions.
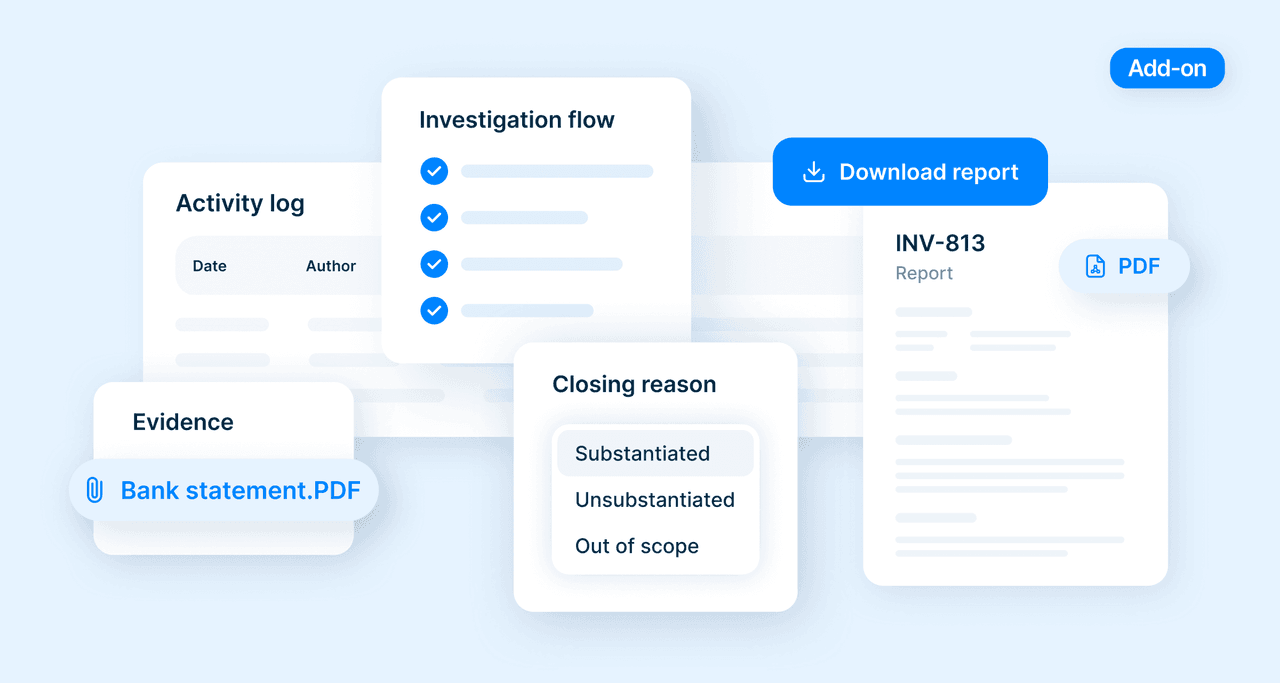
This is where FaceUp comes in. Our platform shows exactly where reports originate and how they’re categorized. But real impact begins when that reporting intelligence is connected to the broader business context.
Compliance data rarely tells a clean story across departments. Safety incidents, behavioral complaints, or procurement disclosures often sit in separate systems. Spreadsheets track one area, HR systems track another, finance holds its own metrics. The signals exist, but they’re rarely viewed together.
Many teams still rely on:
These tools document activity, but they don’t easily surface cross-departmental patterns or emerging trends.
Signals that commonly go unnoticed include:
Real compliance work is complex. Investigations move at different speeds. Thresholds vary across departments. Without integration, systemic risks often become visible only after escalation.
When FaceUp reporting is combined with Power BI analytics, compliance teams can connect case data with operational and financial metrics in one analytical environment.
Dashboards consolidate multiple data sources into a unified view of risk KPIs. Instead of reviewing reports in isolation, teams can monitor patterns, anomalies, and correlations across departments.
Key capabilities include:
This shift moves compliance from reviewing individual cases to monitoring organizational risk patterns. Teams gain earlier visibility into vulnerabilities and can develop mitigation strategies before issues escalate.
Financial and procurement oversight becomes clearer as well. Conflict-of-interest disclosures or vendor-related reports can be analyzed alongside spend concentration, onboarding timelines, or contract data. Visual dashboards and risk matrices allow leadership to interpret trends quickly while maintaining audit transparency.

Integrated dashboards can trigger automated alerts and notifications, connecting reporting signals to workflows in Power Automate. Instead of manually reviewing static reports, teams receive targeted alerts when risk thresholds are exceeded. That means faster response and fewer blind spots.
Several procurement-related disclosures may initially seem harmless. When combined with vendor onboarding timelines and spend concentration analysis, teams may spot that multiple departments rely on the same vendor without consistent due diligence. Individually, nothing looks wrong. Together, these signals reveal a potential financial, regulatory, or reputational risk.
The compliance team configures dashboards to monitor vendor disclosures alongside procurement metrics. Alerts automatically flag unusual patterns and trigger follow-up workflows.
Reviewing reporting data alongside operational performance metrics gives the team a clearer view of vendor risk trends. They can track KPIs, support audit readiness, and surface emerging risks earlier, turning fragmented signals into actionable insights for leadership.
Analytics changes not just what you see, but how you act.
Dashboards let teams rank risks by operational, financial, and regulatory impact. Leadership can allocate resources based on severity, not volume. Risk discussions shift from “How many cases?” to “Where is our real exposure?”
Tracking trends, response times, and corrective actions helps organizations build and maintain clear audit trails. Compliance teams can show exactly how risks were identified, prioritized, and mitigated, supporting regulatory reviews and strengthening internal accountability.
Analytics helps teams focus on the most critical threats, balance workloads, and improve investigation efficiency. Time is spent where risk is highest, not where noise is loudest.
With heatmaps, predictive analytics, and trend modeling, teams spot potential early warning signals before small issues become major problems. Interactive risk matrices and cross-filtered visuals make it easy to explore the data behind the alerts.
Even with incomplete data, unified analytics lets teams make defensible, evidence-based decisions.
Compliance risks rarely appear in a single reporting cycle. Long-term trend analysis is key to understanding how vulnerabilities evolve.
Unified reporting platforms allow teams to consolidate data across systems, supporting structured analytics pipelines without manually reconciling spreadsheets.
Cross-departmental analytics shows how training, restructuring, or operational changes affect reporting behavior using Power BI visuals and governance dashboards. Automated alerts help detect emerging risk clusters before they reach regulatory or reputational thresholds.
This visibility strengthens regulator and auditor engagement. Teams can show how reports were identified, investigated, and resolved, alongside policy updates, training, and control adjustments. Compliance becomes measurable governance, not just case management.

Compliance environments are increasingly complex. Regulatory expectations are growing. Organizations must show not just incident response, but continuous monitoring and proactive risk mitigation.
Integrated analytics supports the transition of compliance toward a more forward-looking governance discipline. Connecting reporting intelligence with performance data helps teams better anticipate potential risks, justify decisions with evidence, and provide leadership with strategic insight.
Regulators increasingly focus on patterns and trends, not just individual incidents. Leadership must prove that reporting data actively informs risk management strategy, operational decision-making, and governance oversight.
Adopting unified analytics strengthens transparency, improves audit readiness, and builds organizational resilience. Compliance becomes a driver of operational stability, not just a reactive function.
At her next quarterly review, our compliance officer doesn’t walk in with a stack of isolated cases. She walks in with a clear risk narrative. Procurement disclosures are mapped against vendor concentration and onboarding timelines. Patterns are visible. Outliers are explained.
Instead of reacting to tough questions, she leads the conversation. The tension is gone. In its place is confidence, grounded in connected data that reflects how risk actually moves across the organization.
Key takeaways for compliance teams:
Watch our step-by-step Power BI tutorial to see how compliance teams can build dashboards, connect multiple data sources, and transform reporting intelligence into real-time risk visibility.

We’ll assess your needs and recommend the right setup for anonymous reporting or surveys - aligned with your compliance or HR goals.
Keep Reading
Alaa El-Shaarawi2026-07-098 min
Legal & Compliance
Marie Roland2026-05-277 min
Legal & Compliance

Marie Roland2026-05-064 min
Legal & Compliance